Search Miami Real Estate
Miami Real Estate News

Market Update for Miami Condominiums

Here's a quick view of the condo market for City of Miami, which includes areas such as Brickell, Coconut Grove, Edgwater, and Wynwood - see the map for all areas.
Key Notes:
*We have 4.9 months of supply of inventory, and that number has risen 14% vs last year, all condo prices combined. This shows we are headed more into a neutral market or more balanced market, from the sellers market we had been in for condos in 2021/2022.
*The average price per square foot of condos sold was $584, which represented a 15.8% increase vs the prior year.
*The averae price per unit sold was up 22.7% in July 2023 - vs the prior year.
*Both the number of active listings, and the number of sold units are down. Depending on the price range and building, we are seeing some areas overall still holding in price, while other higher ranges (depending on inventory) have more price reductions and more negotiating power. Contact me for more details.
MIAMI Real Estate Update | Spring 2023
https://youtu.be/L9EG18QsxeU Here's also the chart I review in this video - This is a Miami Real Estate Market Update.

 Quick Real Estate Market Update for Miami, Coral Gables and Brickell Areas
Video: Miami Real Estate Market Update - The Details
This is an in-depth look at the Miami Real Estate market including overall Miami-Dade, plus: Coral Gables, Coconut Grove, Pinecrest, and Brickell. This video is 10 minutes long and goes over themarket statistics with explanations.
Miami in Hottest Housing Markets for 2023
Miami ranked in Zillow's Top 10 Housing Markets for 2023. Let's explore factors that have contributed to the overall strength of the Miami real estate market and our overall economy in Miami-Dade County in this short video, 3 minutes long.
Video: Miami Real Estate Update & Projections
Overall Projections for 2023 Miami Real Estate, lets take a look at factors that contributed to our growth in the past few years, and look at where we are at now.
Video: Miami Real Estate Market Update
 Real Estate is Regional! Here's a video update for Miami Real Estate, focusing on Coral Gables, Coconut Grove, South Miami, Pinecrest, and Palmetto Bay. This video is 9:50 long and is optimal if watched in front of a larger screen, as market charts are shown.
The Impact of Low Mortgage Rates
July 2020 Marked The Lowest Mortgage Interest Rates On Record
The average rate for a 30 year fixed conventional loan dropped to 3.1% and some lenders have been able to provide even lower rates, depending on one's personal financial picture. Here are a few graphs illustrating the significance of recent lower rates and money saved over the life of the loan. These low rates, along with pent up buyer demand due to the Covid-19 virus and the shelter in place order, have added to our already active market. In many areas and price ranges, we are seeing home sales at a quicker pace and for a higher price. Sellers and buyers both benefit with lower rates because the overall cost of the loan is less and a buyer can qualify for a larger loan amount, motivating buyers to take advantage of this opportunity to make a move.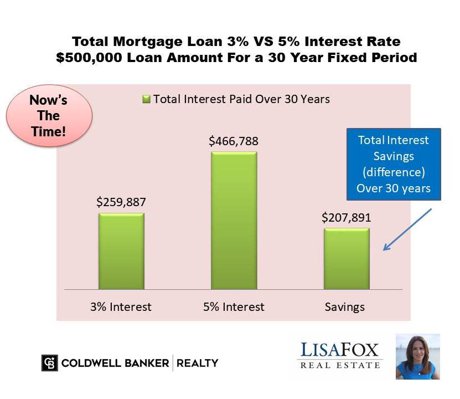
The first chart shows a $500,000 loan amount. The 3% interest rate fixed over 30 years amortized would equate to a total interest paid of $259,887 over the life of the loan, and a monthly payment for principal and interest of $2,108. At a 5% interest over the same period of time, the total interest would equal $466,788, and the monthly payment would be $2,684, or $576 higher per month. The 2% difference represents a savings of $207,891 over the life of the loan. Interest rates were averaging 4.72% in August of 2018, and they have since been hovering around the 4.5 to 4% mark until dropping back below 4% this year. 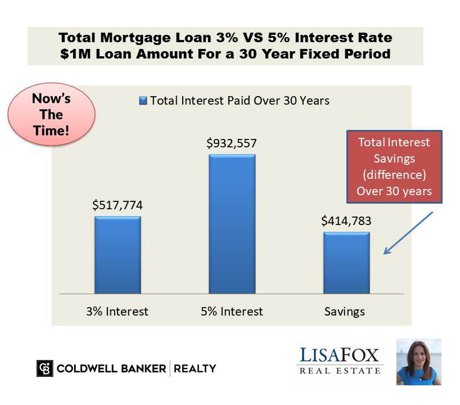
The second chart depicts the same scenario for a $1 Million loan amount. The total loan difference of 2% at that amount equals a savings of $414,783. Rates vary on a day to day basis and what is quoted can depend on a number of factors including a buyer's credit worthiness plus the type of residential loan as there are many options.
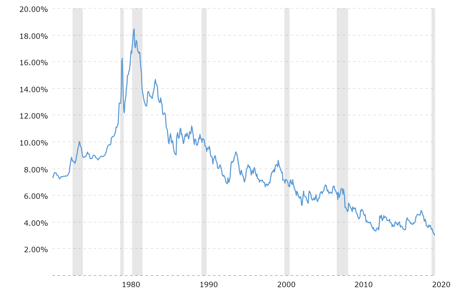
30 YEAR MORTGAGE TREND HISTORY Source: Macrotrends
Miami Real Estate Market Update April / May 2020
Here's the latest on what's going on with Miami Real Estate during the Coronavirus pandemic. The number of sales have been increasing on a weekly basis during April 2020, while new listing inventory has declined. Watch my video for short explanation of our market.